The spread of Covid-19 brought unprecedented change to the housing market. But after lockdown, buyers and sellers defied the forecasts of doom, and real estate came to life again. JAMES WILSON tracks an unpredictable market.
When the last Oneroof Property Report came out, at the start of March, few would have guessed that the housing market was a few short weeks away from a total shutdown. Back then there was momentum in the market and economists were predicting house prices would rise. But by the end of March, the momentum was lost and experts feared the worst, forecasting price falls of 10 to 20 percent.
Start your property search
The word “unprecedented” has been used a lot to describe the Covid-19 crisis. Cliche or not, it's a word that aptly sums up the impact of the lockdown period. Never before in New Zealand's history had the property market and the framework that supports it been shut down.
While it’s too early to tell what the full impact of Covid-19 will be on the housing market, we do know it’s more important than ever to focus on the collation, analysis and correct application of available data to ensure that any decisions made are from an informed position. Conversely, the risk of relying on misleading or incomplete data, or data that may be biased towards a particular outcome, has never been greater.
Before we dive into the data, let’s take a look at how the market performed once the Alert Level Four lockdown came into force on March 26, and in the weeks after restrictions were eased and the country returned to normal.
1. Sales volumes drop:
Confidence is king when it comes to the housing market, and sales volumes for April were well down on the same period last year. Much of this can be attributed to lockdown restrictions such as no open homes, no valuations, and no physical auctions — although in the initial weeks of lockdown, there was a lot of uncertainty which fed into predictions of house price falls and a severe economic recession.
2. Vendors sit on the sidelines:
Listing numbers as the country moved out of lockdown in May were down on the same period last year, as homeowners took a wait-and see approach to the market. This in turn creates heightened demand for the stock that does come to market.
3. Interest rates cut:
One of the immediate responses to Covid-19 was a cut to the Official Cash Rate, which most high street banks passed on to customers. This reduction allowed those who were already looking to buy before lockdown to stretch themselves. 4. Pent-up demand: The drop in new listings and low interest rates, combined with pent-up demand, lead to a quick change in the market. Buyer activity picked up, and properties started selling at pre-lockdown prices. Value levels across much of the country have bounced back, but some locations — such as Queenstown — and property types, particularly apartments, are exposed.
5. Vendors return (but slowly):
Listings numbers for June and July strengthened as vendors returned to the market in an attempt to capitalise on rising prices. However, anecdotal evidence from agents and listing numbers show demand outstripping supply.
6. Back to normal:
Lately, market participants in some locations have revealed a return to normality in the sense that some of the “fear” of what may happen to the housing market has gone away, with prices reflecting a demand for well-presented housing stock.
The OneRoof-Valocity Covid Index
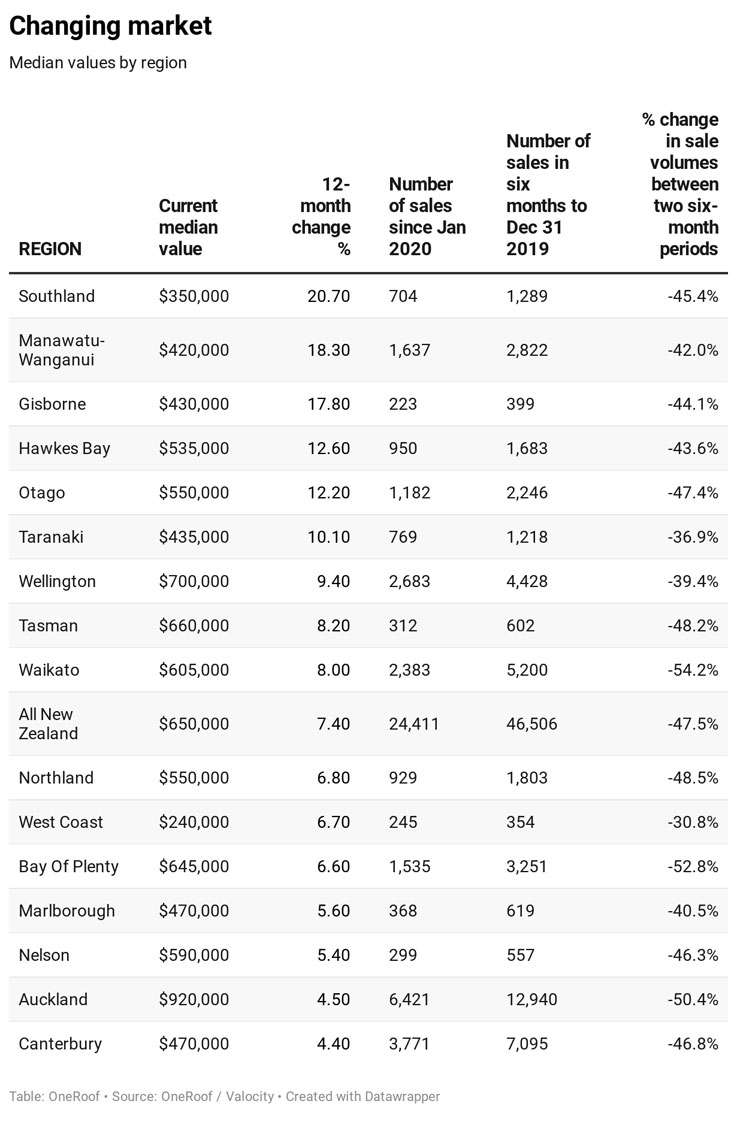
When we look at the housing market using traditional methodology, we run the risk of misinterpreting what's going on in the market. According to latest OneRoof Valocity figures, every territorial authority, bar three, saw a 12-month rise in its median property value, with 33 recording double-digit increases. But the increases are more a reflection of the fact these locations had experienced significant value growth in the six months before lockdown.
To accurately measure the market since start of the Covid-19 crisis, OneRoof and Valocity have created an index that covers a range of different metrics. By breaking down what’s been selling together with the nature of the housing stock in any given location, we can track the actual changes in individual submarkets more effectively.
The OneRoof-Valocity index has applied a baseline figure to property values in every region and territorial authority in New Zealand (where possible the index has been applied at suburb level). Property values on March 25, 2020, the day before the country went into lockdown, are set at 1000 on the index. Every sale since that date has been analysed and a value applied, which has then been tracked in accordance with the baseline value, allowing subtle changes in the market to be measured.
The index shows the impact of the lockdown and how property values have changed since the country returned to normal trading conditions. You can also begin to see the disparity (and danger) of relying solely upon the traditional 12-month value level movement. For example, the median value in Dunedin rose 19.8 per cent in the last 12 months. However, on the index Dunedin house values have slipped 2.5 per cent.
What do the numbers show?
The housing market had been gathering steam in the months before Covid-19 struck, driven by strong growth in the regions and a resurgent Auckland market. Since lockdown the market has been subdued but positive, up 0.5 per cent on the index.
At a regional level, value growth since March 25 has been a mixed bag. In the 12 months leading to into lockdown, the index reveals that seven of New Zealand 16 regions experienced double-digit value growth, with Gisborne out in front with a more than 25 per cent increase. Post-lockdown, the rate of growth has stalled across the board, with no region experiencing more than 4 per cent growth since lockdown (Manawatu-Whanganui is the top performer with 3.77 per cent growth).
Five regions have seen a drop in values on the index — Otago, Northland, West Coast, Nelson and Wellington. The largest decrease is in Otago, which is down 3.42 per cent, driven by the softening of values in Queenstown Lakes.

Queenstown-Lakes suffered the biggest value drop on the Covid index. Photo / Getty Images
When the index is run at a Territorial Authority level we begin to see more variation: of the 72 TAs monitored, 24 are now showing value declines since lockdown, the top five largest being Queenstown-Lakes (-7.7 per cent), Thames-Coromandel (-4.8 per cent), Whangarei (-3.2 per cent), Dunedin (-2.5 per cent) and Kapiti Coast (-1.9 per cent).
The best performing housing markets in the 12 months before March 25 — Gisborne, Dunedin, Whanganui, Horowhenua and Rangitikei, all of which saw growth of between 19 and 26 per cent — have stalled post-lockdown, and in Dunedin's case slid.
The TAs that were running hot pre-Covid were generally lower value locations targeted by investors, who have largely adopted a wait-and-see mentality, easing some of the hype and demand in these locations.
The major metros
When we look into the performance of New Zealand’s main urban metros on the index, the numbers are slightly more positive, with four out of the seven registering values lifts post-lockdown — Hamilton (up 1.86 per cent), Tauranga (+1.22 per cent), Wellington (+1.05 per cent), and Christchurch (+0.47 per cent). Despite an overall dip, there is positivity in Auckland's submarkets, with Franklin up 0.42 per cent and Papakura up 2.04 per cent and Auckland City climbing back to where it was on March 25.
While there is significant variation in the performance of certain property types in each of these locations (Auckland Central's apartment market is exposed to significant volatility), the major metros are in a stronger position than smaller regional housing markets as they tend to have more employment opportunities and more buyers who are purchasing for the long-term utility rather than short-term capital growth. In fact, the slide in Queenstown-Lakes and Dunedin reinforces this hypothesis as both were hot investor markets pre-Covid-19 and Queenstown-Lakes’ position as an employment centre has suffered from the closure of our borders.
Price bands
There are also differences in performance across the different price bands. By comparing the rate growth on the index in the 12 months before lockdown to the rate of growth post-lockdown, we can see the upper price band ($2m-plus) has been impacted the most by Covid-19. While sales volumes in this band are still very low, the downward trend is similar to one that emerged post-GFC, when higher value housing stock was the first to respond to changing market conditions, with buyers in this bracket more influenced by international market conditions than others.
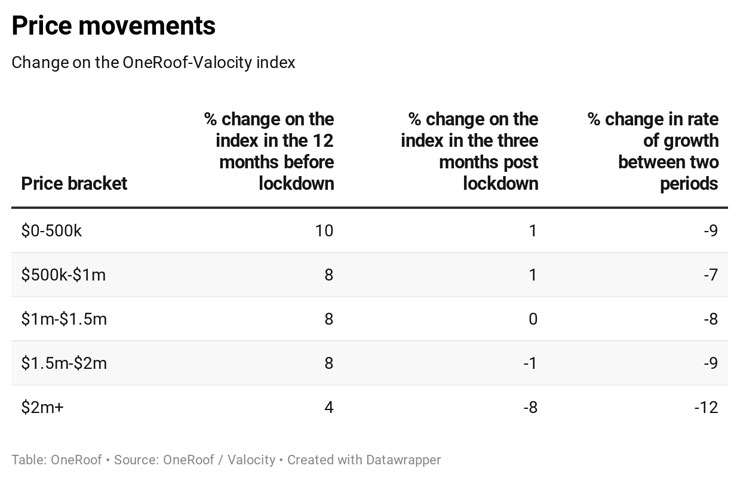
The second largest change to the rate of growth lies in the $0-$500,000 price bracket, where there is a high percentage of investors. The slide may be further evidence of the wait-and-see mentality taking hold in this buyer group.
- James Wilson is director of valuation and innovation at OneRoof's data partner, Valocity.