Click here to download this report >
The housing market has shifted down a gear, with the latest figures from the OneRoof-Valocity House Value Index showing an easing of house price growth across most regions.
The nationwide average property value rose 4% to $1.101 million in the three months to the end of February, down from growth of 5.9% in the three months to the end of January.
Start your property search
In a sign that tighter lending rules and rising interest rates are starting to bite, several regions registered quarterly growth well below the nationwide average - and more than two dozen suburbs suffered house price drops, some as by as much as $60,000.
House prices in Auckland, which had been running hot in the closing months of 2021, were up just 3.8%, while growth in Greater Wellington was a similarly low 3.4% over the quarter.
With house price growth of just 2.3% over the three months, Tasman was the country's weakest region, while Northland, buoyed by an 8.6% lift in Kaipara, was the country's strongest housing market, with quarterly growth of almost 8%.
Canterbury, which had registered growth of 6.7% in the three months to the end of January, had slowed to 4.6%.
Waikato and Bay of Plenty, which had headed into 2022 with growth of almost 7%, dropped in pace to 5.1% and 4.6% respectively.
At a TA level, Westland, Rotorua and Mackenzie appear most vulnerable to house price falls, with all three registering zero or negligible growth over the quarter.
At the other end of the scale, Queenstown-Lakes turned in growth of 10.4% to $1.851m over the same period, the result of big ticket sales and increased confidence in the city's housing market.
Of the major metros, Auckland has slowed the most over the quarter. The city's western suburbs are more exposed with growth of just 1.1%, but North Shore and central city suburbs were also subdued, with growth of between 3.3% and 3.4%. Franklin, on the city's southern fringes, is Auckland's strongest growth region - it was up 6.3% over the quarter.
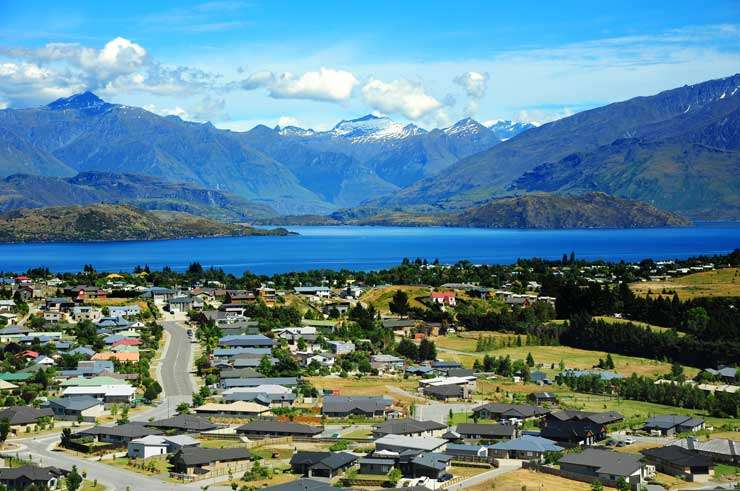
Wanaka in Queenstown Lakes, where house prices have jumped more than 10%. Photo / Getty Images
Growth in Christchurch, Hamilton, Tauranga and Wellington was all around the 4.5% mark, while growth in Dunedin was slower, at 3.6%.
The country's most expensive places to buy property remain Queenstown-Lakes and Auckland City - average property values of $1.851m and $1.783m respectively - while the cheapest is still Buller, on the West Coast, with an average property value of $361,000.
HOUSING MARKET AT A GLANCE
New Zealand's average property value grew $215,000 in the last 12 months. Northland and Taranaki have been the hottest regions over the quarter, recording value growth of 7.9% and 6.7% respectively. Hauraki is the country's best-performing TA, with its average property value up 16.6% in the last three months to $816,000.
Most expensive: Herne Bay, in Auckland, is New Zealand's most expensive metro suburb, with an average property value of $4.187m. Speargrass Flat, a lifestyle suburb north of Queenstown, has the highest overall average property value, at $4.845m.
Cheapest: With an average property value of $233,000, Runanga, in Grey, is the best place to bag a bargain.
In demand: Whiritoa, in Hauraki, had the biggest quarterly growth, with its average property value up 23.8% to $1.088m. Ninety-one suburbs in total saw their average property value grow by more than 10% in the last three months.
Biggest winner: Speargrass Flat gained the most, dollar-wise, in the last 12 months. Its average property value rose $1.104m. Year on year, 34 suburbs saw their average property value grow by more than $500,000.
Cooling off: The suburb that has suffered the most over the last 12 months is Matipo Heights, in Rotorua. Its average property value grew just 1% year on year and fell 4.8% ($59,000) in the last three months. All up, 24 suburbs have seen negative or zero growth in the last three months.
* Figures only cover suburbs with 20-plus settled sales in the last 12 months.
REGIONAL BREAKDOWN
NORTHLAND
Northland is the country's strongest housing market, with the region's average property value growing 7.9% in the three months to the end of February, up from 6.9% growth in the three months to the end of January.
The region has enjoyed strong buying activity across the board, but Kaipara has led the pack, with its average property value up 8.6% QoQ to $983,000.
The TA is likely to continue to benefit from Aucklanders seeking a bach at more affordable price points, with the jump in activity from multi-homeowners and investors across the region a strong indicator that it is growing in popularity as a location for holiday homes.
First home buyers continued to be active in the region, registering 35.6% of all mortgage registrations, although this is down from 38.5% in the previous quarter. Investors' share of mortgage registrations remained relatively stable at 21.7% compared to three months prior at 21.4%.
With an average property value of $2.235m, Langs Beach, north of Mangawhai, is Northland's most expensive suburb, while Kaikohe, in the Far North, is the region's cheapest, with an average property value of $390,000.
GREATER AUCKLAND
The downwards shift in Auckland's housing market is a concern. The overall QoQ growth figure for Greater Auckland is 3.8% is one of the lowest for the period, and some areas in the city are in far weaker position. Waitakere's growth over the period is just 1.1%, while the North Shore and central city suburbs have also been subdued.
House values fell in five Auckland suburbs - Torbay (-4%), Avondale (-3.7%), Auckland Central (-3%), Glen Eden (-1.3%), Te Atatu Peninsula (-0.3%) and New Lynn (-0.1%). Expect more suburbs to join them in the negative growth club (Browns Bay, Forrest Hill, Okura Bush, Te Atatu South and Sunnynook are looking vulnerable) as buyers and sellers adjust to the new market realities.
Of the Auckland suburbs that registered 20 or more settled sales over the 12 months to the end of February, 24 saw value growth of more than 10%, with houses on Waiheke Island enjoying growth of more than 15%.
Just 16 suburbs with 20 or more sales over the last 12 months have an average property value of less than $1m, down from 24 three months ago, while 54 have an average property value of $2m-plus.
First home buyers' share of mortgage registrations for the quarter was 40%, unchanged from the previous quarter. They were particularly active in Waitakere (47.4%), and Papakura (42.2%).
Investors' share of the Auckland market dropped from 28.2% to 26.1%, with many repositioning their portfolios to adapt to the new interest deductibility rules. The buyer group was most active in Manukau (29.4%) and Papakura (31.4%), where rental yields are still attractive.

A real estate window in Auckland. The market in the city has shifted in favour of buyers Photo / Fiona Goodall
Building Consent activity in Auckland is at a record level; however, the shortage of labour and materials are delaying the completion of these homes.
Herne Bay remains Auckland's most expensive suburb. Its average property value of $4.18m is six and a half times more expensive than the city's cheapest suburb, Auckland Central, which has an average property value of $644,000.
WAIKATO
Waikato's average property value is just $7000 shy of hitting $1m, with the region enjoying QoQ value growth of 5.1%, although down on the 6.4% growth registered in the three months to the end of January.
Hauraki is the region's hottest housing market; its average property value jumped 16.6% over the quarter to $816,000. Nipping at its heels with QoQ growth of 13.3% is Waitomo. Both markets were fuelled by strong buyer demand and limited supply.
Hamilton's QoQ growth held steady at 5.3%, with its average property value rising to $937,000. However, mortgage registration figures show changing dynamics within the city. First home buyers' share of purchases over the quarter fell from 40.1% to 34.7%, as tougher lending restrictions took effect. There was a slight increase in investor activity, with their share of purchases up from 28.6% to 30.9% on the back of attractive rental yields.
In Hamilton, there is an abundance of brownfield redevelopments providing townhouses in the established suburbs. However, it may take time for buyers to adjust to townhouse or apartment-living, as evidenced by the value growth of new standalone home in the city’s north-eastern suburbs.
New build activity in Huntly and Pokeno will look to net city buyers seeking lower prices and larger land parcels. Much needed new housing at the Sleepyhead Estate in Ohinewai will also commence in 2022. However, the shortage of materials and labour will impact their completion dates.
Tamahere, on the outskirts of Hamilton, is the region's most expensive suburb, with an average property value of just over $2m. Tokoroa, south west of Rotorua, is Waikato's cheapest housing market, with an average property value of $470,000.
BAY OF PLENTY
Value growth in the Bay of Plenty has slowed from 5.7% in the three months to the end of January to 4.4% in the three months to the end of February.
The region's still solid performance has largely been driven by buying activity in Western Bay of Plenty (up 8.1% QoQ to $1.32m) and Tauranga (up 4.5% to $1.244m) and Whakatane (up 4.4% to $812,000).
House price growth in Kawerau and Opotiki has stalled, but Rotorua is the real concern, where the average property value rose a negligible 0.4% QoQ to $758,000 following a retreat from the market by investors.
House prices in 26 of the 49 suburbs in Rotorua territorial authority dropped over the quarter - some by as much as $86,000 (Lake Tarawera's average property value fell by 5.3% from $1.622m to $1.536m).
In Tauranga, suburbs dominated by lifestyle properties have performed the best, Tauriko and Ohauiti recording value growth of more than 10%, well above the city's overall QoQ growth figure of 4.5%.
Demand continues to outpace supply in the city, leading to 15 of its 23 suburbs having an average index value over $1m, up from five suburbs a year ago. Buyers unable to buy in the city have been forced to search in the neighbouring Western Bay of Plenty, which has driven the market there.
First home buyers continued to be active in the Bay of Plenty, but their share of the market has dropped from 39.2% to 36% over the quarter. Investors' share of new mortgage registrations meanwhile eased from 23.9% to 22% over the same period.
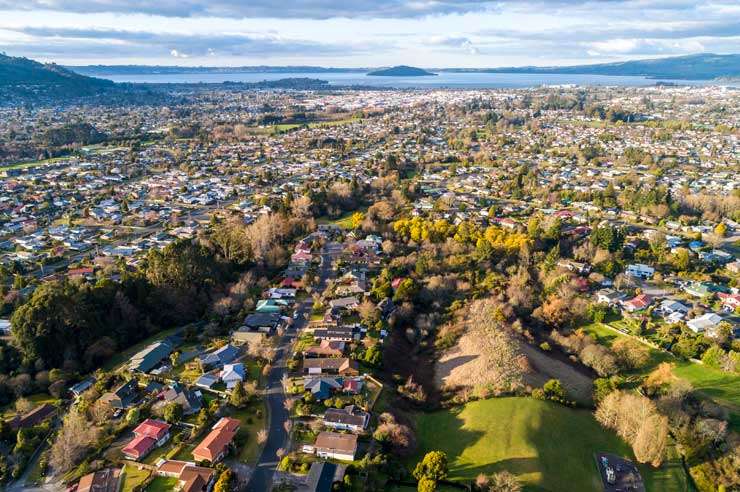
An aerial view of Rotorua. The city's low growth is a cause for concern. Photo / Getty Images
In Tauranga, purchases by movers and multi-homeowners rose, reflecting the city's attraction to outsiders as a place to live or as a place to have a holiday home.
With an average property value of $2.275m, Tauriko is the Bay of Plenty's most expensive housing market, while Ruatahuna, south of Whakatane, is the cheapest, with an average property value of $110,000.
CENTRAL NORTH ISLAND
The central North Island regions recorded solid QoQ value growth of between 4.2% (Manawatu-Whanganui) and 6.7% (Taranaki), with little in the way of change since January's QoQ figures, reflecting the area’s lifestyle and employment opportunities.
In Manawatu-Whanganui, the share of purchases by first home buyers over the quarter increased from 34% to 36.6%, but the share of investor purchases dropped from 25.6% to 19.9%. The decline in investor activity was more evident in Palmerston North, with their share of purchases plummeting from 29.8% to 16.6%.
Investors have also retreated from Gisborne, with their share of purchases over the quarter from 29% to 20%, a worry since much of the value growth in the region since the end of the first Covid lockdown in 2020 has been driven by investors seeking out cheap stock with high yield potential.
In Hawke's Bay, growth was stronger in Hastings (up 7% QoQ to $1.014m) and Central Hawke's Bay (up 9.1% QoQ to $747,000), mostly driven by owner-occupiers seeking lower-priced properties away from the main centres. First home buyers increased their purchases in Napier and Hastings, highlighting both cities continued attraction.
Taranaki's QoQ growth rate outperformed the New Zealand average, rising 6.7% to $715,000. For years, house price growth in the region's largest city, New Plymouth, lagged behind the rest of New Zealand, but this quarter the growth rate was a strong 6.8%, pushing its average property value to $791,000.
Demand has continued to outpace supply in the region, with future stages of development brought forward to meet buyer appetite. However, buying activity by first home buyers and investors has slid - which may indicate softer growth ahead.
Most expensive
• Gisborne - Wainui. Average property value of $1.646m
• Hawke’s Bay - Waimarama, in Hastings. Average property value of $1.66m
• Manawatu-Whanganui - Aokautere, in Palmerston North. Average property value of $1.294m
• Taranaki - Oakura, in New Plymouth. Average property value of $1.288m
Cheapest
• Gisborne - Outer Kaiti. Average property value of $514,000
• Hawke’s Bay - Wairoa. Average property value of $346,000
• Manawatu-Whanganui - Taumarunui, in Ruapehu. Average property value of $352,000
• Taranaki - Patea, South Taranaki. Average property value of $334,000
GREATER WELLINGTON
House prices in the region have softened, with the average property value up 3.4% over the three months to the end of February to $1.138m - a drop from the 4.3% growth recorded over the three months to the end of January.
Within Greater Wellington, growth was weakest in Porirua, up 1.8% QoQ to $1.071m, with Lower Hutt (+2.3%) and Kapiti Coast (+2.6%) in a similarly prone position.
House price growth in the capital held steady at 4.4%, down only slightly on January's figures, but in line with its growth trajectory over the past six months.
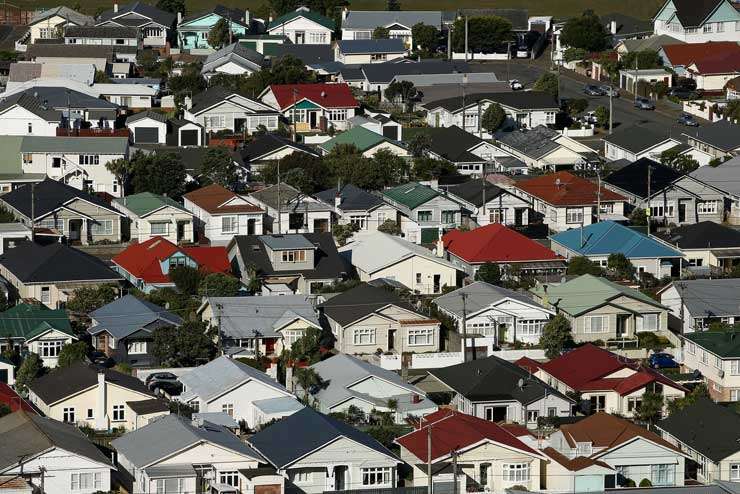
The view over Lyall Bay, Wellington. House prices in the capital have held steady. Photo / Getty Images
Carterton saw the strongest growth over the quarter, with its average property value up 6.6% to $891,000. Masterton, up 5.1%, also performed better than the national average.
The change in the region's sales composition, with lower-priced homes dominating, appears to have had an impact on the value trend for the wider region.
First home buyers' share of purchases in the capital rose over the quarter from 44.7% to 45.6%, while investors continued their exit from the market, with their share of purchases sliding from 21.5% to 16.9%.
First home buyers also dominated in Lower and Upper Hutt, accounting for 45.7% and 40.8% of purchases over the quarter. Porirua had the highest share of purchases by first home buyers over the quarter at 49.2%.
Demand currently outpaces supply in Wellington and the Hutt Valley. Many older homes in established suburbs are being demolished or removed for townhouse developments, but the shortage of materials and labour may have an impact on completion dates.
Prices fell in two suburbs, and barely grew at all in a further two. The average property value in Thorndon, in central Wellington, dropped 4.1% ($50,000) to $1.159m, and in Wainuiomata, in Lower Hutt, a 0.3% drop pushed the average property value down $2000 to $798,000.
On the watch list are Mount Cook and Wellington Central, in the capital. Value growth in both was just 0.3% over the quarter.
Of the Greater Wellington suburbs that recorded more than 20 settled sales in the last 12 months, the cheapest and most expensive were two that are dominated by apartments, although at either end of the housing market. Oriental Bay, in Wellington, is at the top with an average property value of $2.658m and Wellington Central is at the bottom with an average property value of $643,000.
UPPER SOUTH ISLAND
Most of the regions in the upper South Island saw modest value growth over the quarter of around 4%, slightly down on the 5% growth recorded in the three months to the end of January.
There are two outliers though: Tasman's average property value grew just 2.3% QoQ, nudging it just over the $1m mark, but still a big drop on the 5.1% growth seen in the January figures. And West Coast's average property value - the country's lowest - grew 5.6% QoQ to $396,000, slightly down on the previous quarter's 6% growth rate.
In Nelson, Marlborough and Tasman demand was driven by buyers looking to relocate to attractive lifestyle suburbs, whereas the surge in West Coast's house prices was driven by first home buyers and investors looking to take advantage of the region's low prices.
While West Coast's performance looks strong, it is off a low-value base and based on a very low sales volume.
Most expensive
• Marlborough - Waikawa. Average property value of $960,000
• Nelson - Britannia Heights. Average property value of $1.66m
• Tasman - Redwood Valley. Average property value of $1.63m
• West Coast - Blue Spur, Westland. Average property value of $664,000
Cheapest
• Marlborough – Riverside. Average property value of $600,000
• Nelson - Toi Toi. Average property value of $640,000
• Tasman – Takaka. Average property value of $735,000
• West Coast - Runanga, Grey. Average property value of $233,000
CANTERBURY
House price growth in Canterbury took off in the last half of 2021, reaching highs of more than 9% in October and November, but the market has slowed, with growth in the last three months dropping to 4.6%.
Of the region's nine TAs, Selwyn has best managed to hold onto last year's momentum, with its average property value rising 5.9% QoQ to $1.002m (the first Canterbury TA to break the $1m mark).
Much of that growth has been the result of new-build activity and spill-over buyers from neighbouring Christchurch.
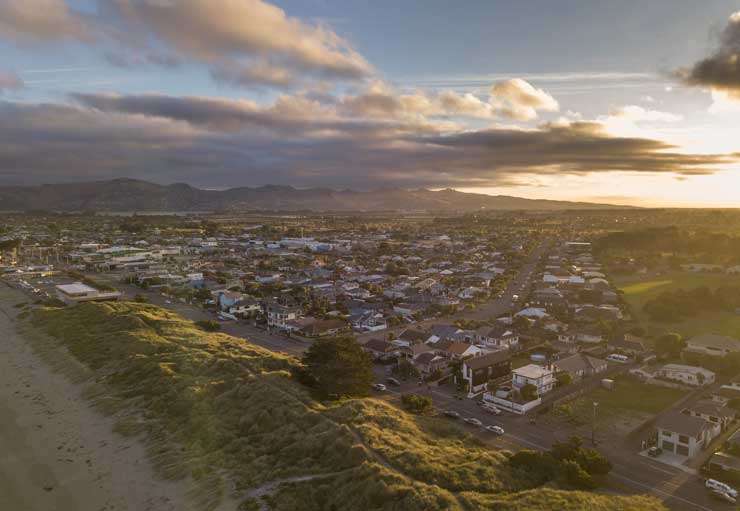
Houses in New Brighton, Christchurch. House price growth in the city has slowed. Photo / Peter Meecham
At risk is Mackenzie, where QoQ value growth was just 0.8% to $767,000. Sales activity in the TA has been low, with most of the buying activity in Twizel, where QoQ growth was a low 1.7%.
Christchurch's housing market has started to cool, but house prices in the city are still relatively affordable, with the city's average property value half of what buyers are facing in Auckland. Several Christchurch suburbs are over-performing: Upper Riccarton registered QoQ value growth of 11.7%; Strowan's average property value rose 11.1%; and North New Brighton was up 9.5% to $565,000.
First home buyers were responsible for 44.9% of purchases in the city over the quarter, slightly up from 44.2% in the previous three months, while investors' share of purchases dropped from 27.6% to 22.9%.
Of the Canterbury suburbs that recorded more than 20 settled sales in the last 12 months, the most expensive is Kennedys Bush, in Christchurch. It has an average property value of $1.85m. The cheapest Canterbury suburb is Hampstead, in Ashburton, where the average property is $436,000.
LOWER SOUTH ISLAND
Otago and Southland saw below-average house price growth for much of last year - six months ago it was running at 2% and 3% - but both have picked up in the last three months. Otago's average property value rose 6.4% to $960,000 and Southland's was up 5.6% to $529,000.
Much of Otago's overall growth is being driven by Queenstown-Lakes, where the average property value jumped 10.4% ($180,000) over the quarter to $1.851m, on the back of some big ticket sales and strong buying activity in Queenstown itself and Wanaka, Jacks Point, Frankton and Arrowtown. Investors are the dominant buyer group in the TA, increasing their share of the market from 33.4% to 37.1% over the quarter (first home buyers' share of purchases dropped from 33.4% to 27.5%).
Otago's other main centre, Dunedin, the country's cheapest major metro, has not fared as well, turning in QoQ value growth of 3.6%. However, suburbs with a high share of sales activity, such as Dunedin Central, Saint Clair, Maori Hill and Karitane, saw value growth well above the national average.
First home buyers continued to thrive in the city, with their share of purchases over the quarter rising from 40.7% to 43.9%. Investors' share of the market slid from 22.9% to 18.2% over the same period, reflecting the uncertainty of the student rental market, rising interest rates and tax deductibility changes.
Southland TA led the region in value growth, with the largely rural territory's average property value up 7.8% to $566,000, but much of that growth is off low sales and a low value base.
Growth in Gore and Invercargill over the quarter was a solid 4.4% and 4.6% respectively, largely driven by the locations' low prices.
Most expensive
• Otago - Speargrass Flat, Queenstown Lakes. Average property value of $4.845m
• Southland - Waihopai, Invercargill. Average property value of $1.08m
Cheapest
• Otago - Kaitangata, Clutha. Average property value of $288,000
• Southland - Mataura, Gore. Average property value of $245,000


