There are more multi-million-dollar homes in a suburb near you than ever before and you might be surprised how much buyers pay for these homes – on Waiheke Island, for example, the gap between the top 1% and the average property value is 606%.
OneRoof’s data partner Valocity looked at how the growth of property values has tracked over the last five years within the top 1% of the market and the bottom 10%.
Start your property search
The data shows 1% of Auckland properties are worth more than $5m, and that of all properties nationwide with a value of $5m or more this year nearly 80% are in Auckland with Queenstown having the next highest concentration at 9%.
The data also shows there is now a $1m gap between the top and the bottom of the market across the country.
The data found that of 24 suburbs where the average property value of the top 1% is over $10m, 18 are in Auckland and the rest are in Queenstown-Lakes.
There are 79 suburbs where the average property value of the top 1% bracket is under $1m with most of those in the West Coast and Southland.
There are 298 suburbs where the gap between the average property value and the average property value of the top 1% is under 200%.
But there are just six suburbs where the gap is over 500% - Glenorchy, at the northern end of Lake Wakatipu, Te Mata on the Coromandel, Waiheke Island in Auckland, Palm Beach on Waiheke Island, Mahurangi East in Rodney, and Ostend, also on Waiheke Island.
In 291 suburbs the gap between the average property value and the average property value of the top 1% is under 100%, plus there are 30 suburbs where the gap is under 50%, 12 of which are in Greater Wellington.
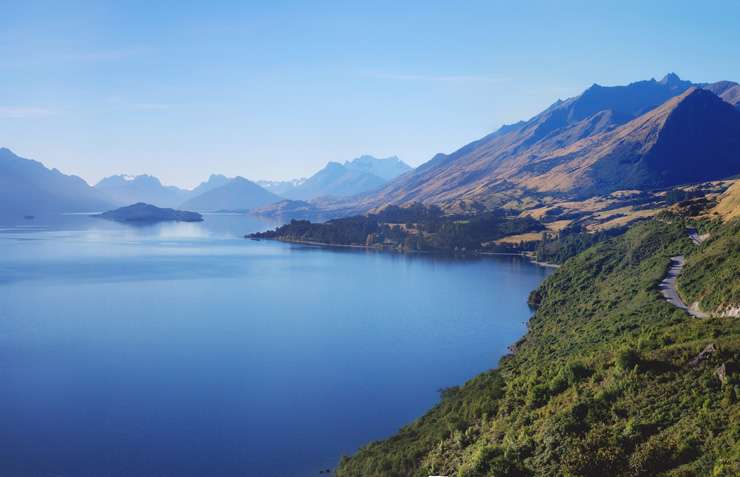
Glenorchy, in Queenstown, where the wealthy can pay above $15m for a home. Photo / Getty Images
In terms of value, Auckland comes out top of the top 10 suburbs where the wealthy homes are, with Waiheke Island sitting at number one.
The average property value of the top 1% on Waiheke is just over $27m, compared to an average property value on the island of $3.5m – that means the top 1% average value is around $23m higher than the average value – a 606% difference.
The number two spot goes to the inner-city suburb of Herne Bay in Auckland. The average value for the top 1% was $23.646m, compared to an average property value of $19.454m, a 464% difference.
Speargrass Flat in Queenstown-Lakes is number three with the average property value for the top 1% over $18m, over $5m more than the average property value.
Glenorchy in Queenstown-Lakes saw a dramatic 1081% difference between the top 1% and the average property value at over $15m in the top 1% and $1.285m.
In Te Mata, on the Coromandel, the difference was 730%, with the average value of the top 1% sitting at $8.62m compared to $1.039m for the average property value.
Suburbs where the difference between the overall average and the top 1% is smallest include Ataahua in Christchurch, Burswood in Manukau, and several suburbs in the Wellington region.
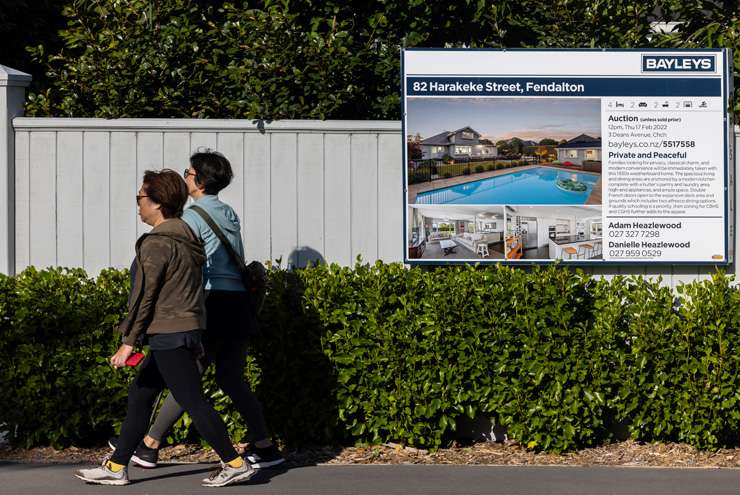
The top five 1% suburbs in Christchurch include Fendalton and Merivale, and in Dunedin Maori Hill tops the list followed by Saint Clair.
In Hamilton, Rototuna North tops the list followed by Queenswood and Flagstaff, while in Tauranga Mount Maunganui takes the top spot with a 425% difference between the top 1% and the average property value, and in Wellington Oriental Bay, Roseneath, Seatoun and Kelburn are the top 1% suburbs.
Lake Tarawera tops the list for Rotorua and in Whanganui it’s Westmere.
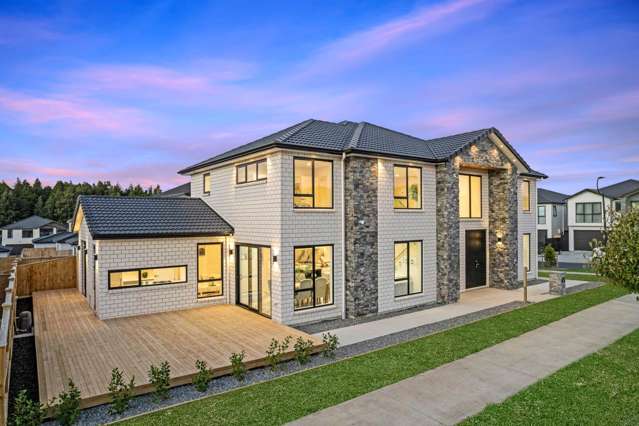
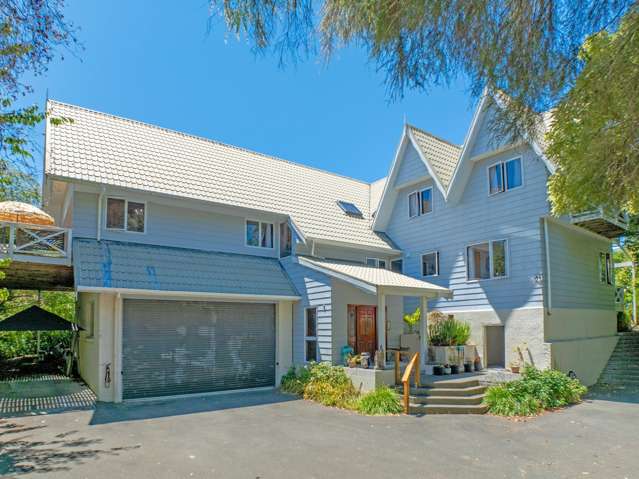
A house for sale in Fendalton, Christchurch. The average value of the top 1% of homes in the suburb is just over $7m. Photo / Peter Meecham
Valocity’s head of valuations, James Wilson, says the data also reveals the number of residential properties valued at under $500,000 has dropped significantly over the last five years, from 649,744 to 184,646.
All regions across New Zealand, apart from Southland and the West Coast, now have their lowest valued properties sitting between $500,000 and $749,000, he says.
Between 2017 and 2021, both the top 1% and the bottom 10% of the market exceeded the national average growth rate, according to the Valocity Value Index.
This indicates the growth was predominantly coming from the bottom 10 per cent group pushing market prices up, Wilson says.
However, this year both groups have fallen below the national average, with the bottom group sitting at 10.3% and the top 1% sitting at 12.7%, compared to 18.9% nationally.
“The bottom 10% was the first group to decline this year, likely due to a combination of affordability of buyers looking for entry level homes and a reduction in investor demand for this type of property.
“Less demand for entry-level properties takes the upward pressure off prices, creating the softening we are now starting to see.”

Valocity head of valuations James Wilson: “The bottom 10% was the first group to decline this year.” Photo / Fiona Goodall
In Auckland, however, the top 1% value growth significantly exceeded the bottom 10% group between 2017 and 2020, which Wilson says indicates the top 1% has produced a “dragging up” effect on overall value levels, as opposed to being driven from the bottom 10% as seen in other regions.
He says an analysis of how the value growth translated to house prices shows Auckland with the biggest difference between the average value of the top 1% group and the bottom 10%, at nearly $3.25m.
At the opposite end, and at the opposite end of the country, the West Coast the difference was only $395,000.
Says Wilson: “In 2022, the gap is now over $1m across all regions, the largest still being in Auckland at $6.721m and the smallest in the West Coast at $1.012m.”
The majority of Auckland’s residential homes are valued between $1m and $1.5m, with the Waikato region now on the cusp of moving into those values.
Wilson says the share of properties in Auckland in the $5m-plus price range grew from .4% in 2020, to 1% this year, however, Tauranga has experienced the highest growth of homes in this price bracket since 2021.
Nationwide, .4% of properties sit within this range.
Wilson says analysing the housing market this way shows where the value growth has been driven across the last market cycle.
“We’ll be monitoring the trends to see if the high value stock continues to grow at a faster rate than the average, which will confirm that this group is less impacted by current market conditions.”