Why is the market booming?
Normally a drag on buying and selling in this country, as voters sit back and await various policy announcements, the election was a non-event this time around. Covid-19 hasn’t put the hand brake on the housing market either, although the pandemic’s effect on house prices is more complicated than the election’s.
The re-emergence of the virus in Auckland and the subsequent level three lockdown in the city came as the housing market was hitting its stride. August sales barely registered the seismic turn of events and September saw several billions of dollars’ worth of real estate transactions.
Start your property search
Outweighing the election and the pandemic, at least from the market’s point of view, is the Reserve Bank’s decision to cut interest rates at the start of the crisis in March and the removal of the loan to value ratio restrictions. Both actions have lured buyers back into the market in numbers not seen since the last boom, although to be fair the removal of the LVR has been more of a psychological boost to the market than a practical one, as banks are still cautious about the amounts they are prepared to lend, and are more rigorous in assessing future income post-Covid.
The FOMO factor – fear of missing out – can be seen to be at play, as first home buyers decide now is the best time to get a foot on the property ladder. The big price reductions predicted at the start of the Covid crisis have not come to pass, especially since the extension of the wage subsidy and mortgage deferral schemes, and buyers can see that a wait-and-see approach will not do them any favours.
Prices have steadily risen since lockdown, while anecdotal evidence shows big numbers at open homes and more competition at auctions. Investors are back in the fray, even in more expensive markets, such as Auckland, and movers see the chance to capitalise on low interest rates and the capital they’ve accrued in their home. The demand side of the ledger has been given a further boost by the surge in net migration, as expats returned home and put pressure on the market.
A shortage of stock is also apparent but it’s not as simple as too few listings. Immediately post-lockdown, the dearth of homes did intensify competition in the market, but listing levels are now back to solid levels. The problem is that demand still outweighs supply, and homes are selling fast.
What do the numbers show?
The OneRoof-Valocity house price index shows the New Zealand housing market started 2020 in a good place, registering 9.1 percent value growth for the 12 months to March 25, the day before the country went into a lockdown to halt the spread of Covid-19. After an initial drop, when the housing market was on hold, nationwide values on the index have strengthened, and are up 5 percent on where they were seven months ago.
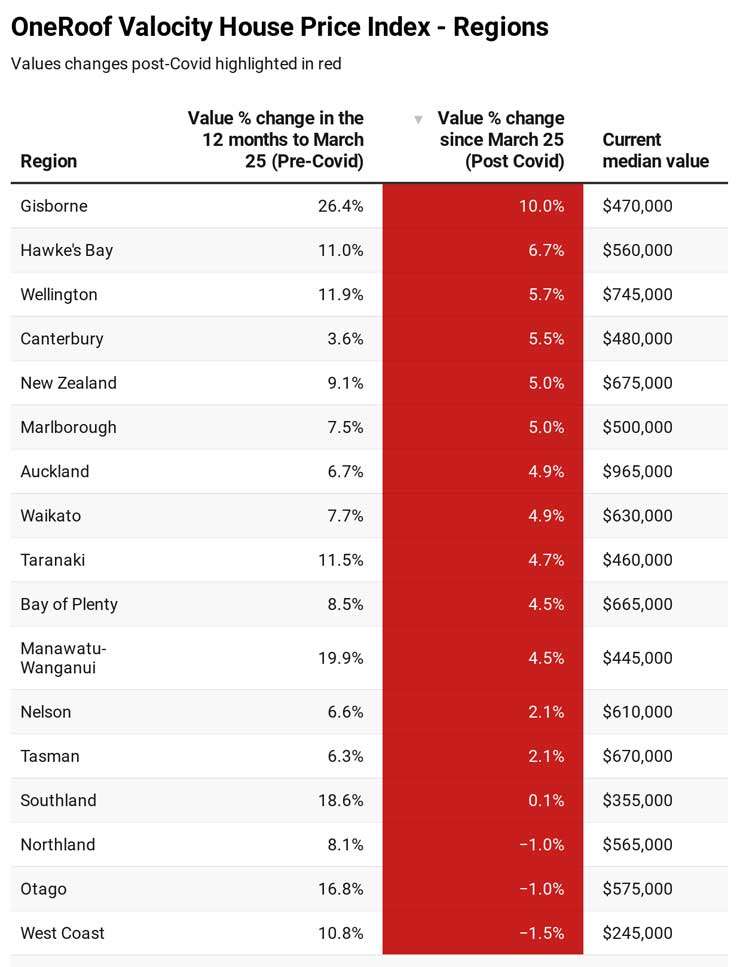
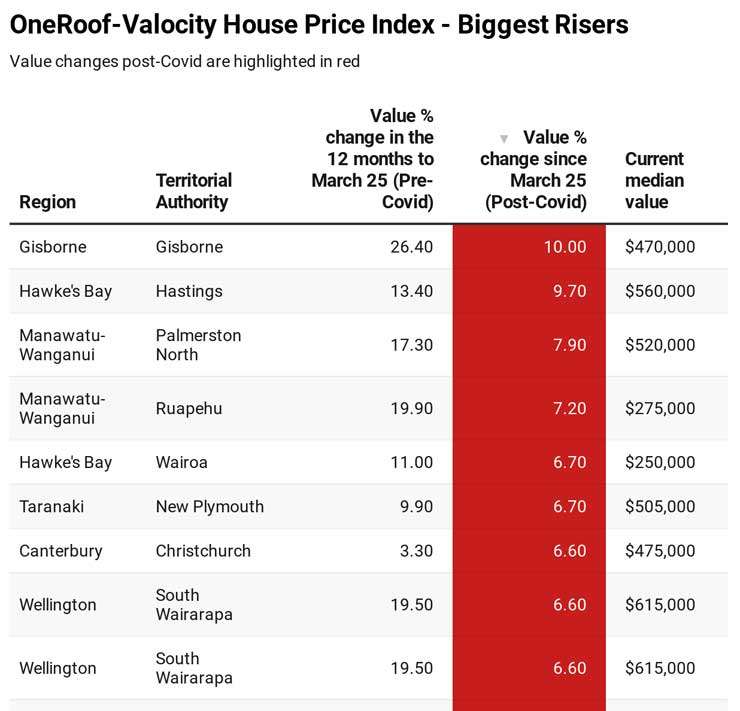
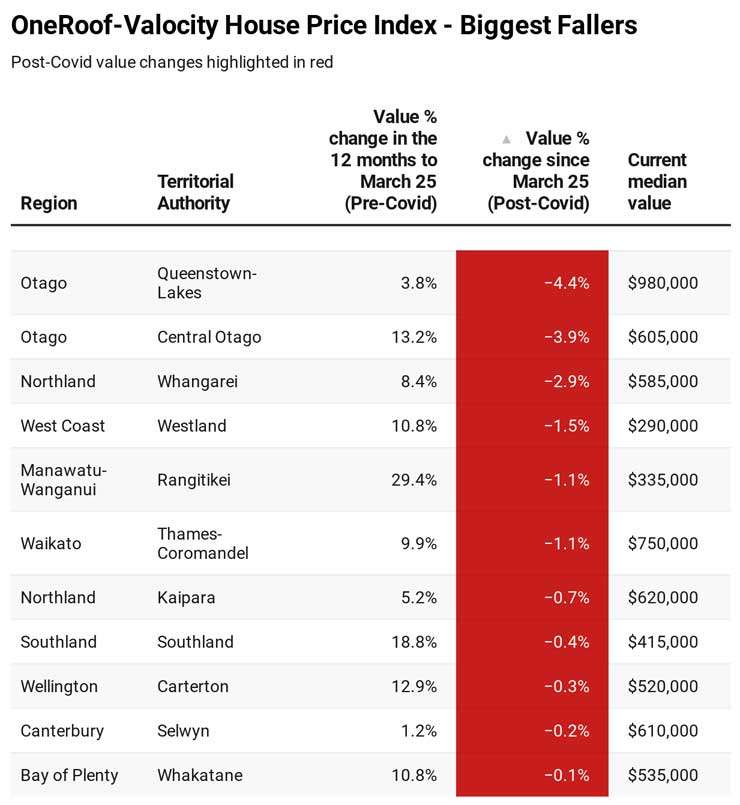
The best-performing regions on the index are Gisborne and Hawke’s Bay, with values up 10 percent and 6.7 percent respectively. A lot of that has been fuelled by the relative low cost of housing in both regions and equity being pulled out of Auckland to go into cheaper markets. Most of the regions have recovered from the initial lockdown slump, with West Coast, Northland and Otago the only regions to show declines in values.
Winners and losers
Market confidence can be seen most clearly at a territorial authority (TA) level. Of the 72 TAs measured, just 11 showed negative growth, down from 22 TAs at the start of August. No TA showed a drop in values of more than 5 percent, with property values in Queenstown-Lakes, the worst-hit market, now only 4.4 percent off where they were in March 25, a 3.3 percentage point climb in the last three months.
Annual rates of growth are significantly softer than they were pre-lockdown, but we are beginning to see some strong performers and trends emerge:
• TAs with lower median property values have generally performed better than those with higher median values, although there are exceptions.
• Gisborne remains New Zealand’s best-performing housing market, with values there up 10 percent on the OneRoof-Valocity house price index.
• Investors who had been waiting on the side-lines at the time of the last lockdown, perhaps in the expectation that prices would fall, are now actively re-entering lower-priced regional markets, putting pressure on first home buyers and adding further heat to the market.
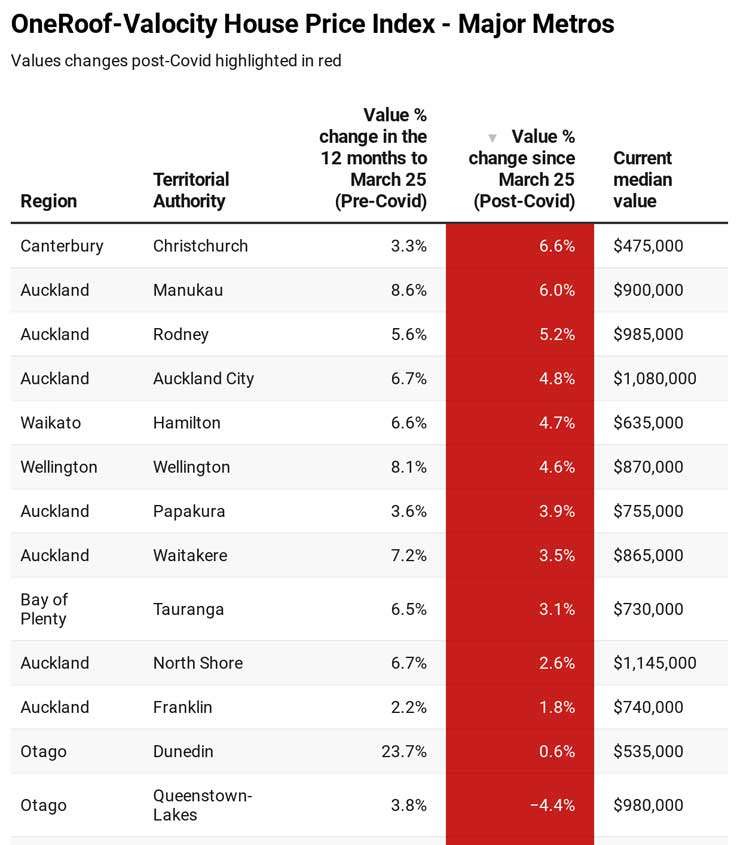
• Every region in Auckland is registering growth, with Manukau, Rodney and Auckland City showing the biggest increases.
• Continued strong growth post lockdown in Christchurch has marked the city as the place for first home buyers.
• Dunedin, the star of the NZ housing market pre-Covid, is struggling to find its place post-Covid.
Price movement
There is also a lot of variation going on the different price brackets, a trend also observed during the global financial crisis.
The biggest changes are in the lower price brackets, 0-$500K and $500K-$1m. The rate of growth for these two brackets – both registering strong growth before the Covid crisis – has softened since March 25. Investors tend to be over represented in both brackets, and the figures may be further evidence of the initial “wait and see” mentality sucking some of the oxygen out of that market.
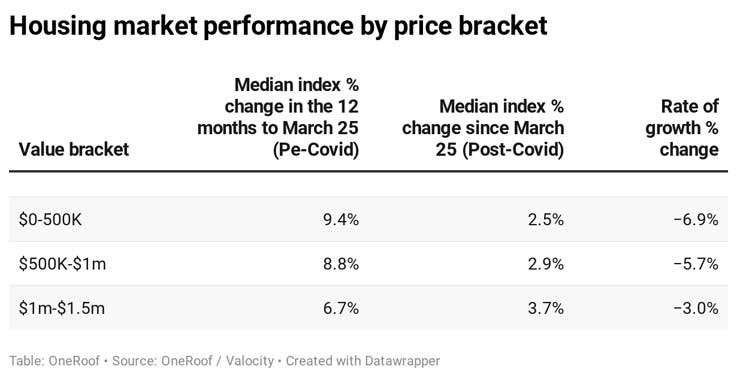
The rate of growth change is best in the $1m to $1.5m bracket, which reflects the impact of movers and investors re-entering some of New Zealand’s larger urban markets.
Who's active, who's sitting on the side-lines?
The overall sales value of stock sold post lockdown is expected to go a long way to make up the shortfall caused by the locked down and disrupted market conditions, with total settled sales value of stock sold already at around 60 percent of 2019 levels, with sales in some extremely busy months still to settle and show up in the overall figures. And there are still two months to go.
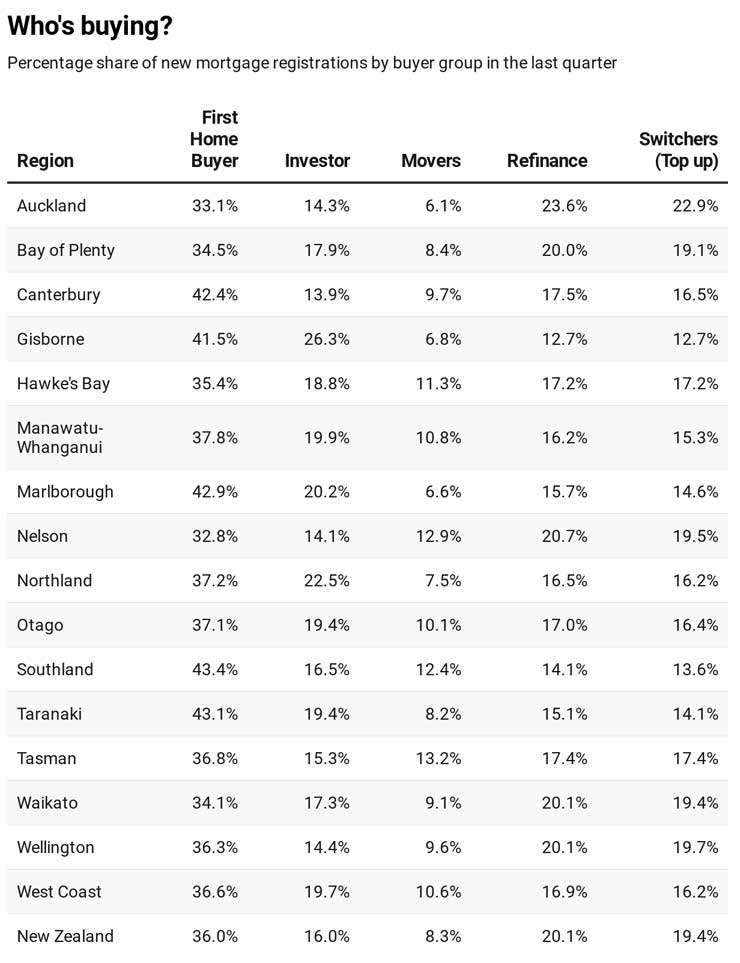
Analysis of mortgage registration over the last five years reveals some key themes:
• The number of new mortgage registrations to movers has been on a downward curve since 2015. This group was very active during the ‘boom’ period of 2013-2016 but is now sitting on the side-lines, showing more caution than other buyer groups. This is even more evident since the Covid crisis, with registrations to movers now only representing 8.3 percent of new mortgage registrations nationwide.
• First home buyers represented about 25 percent of new mortgage registrations in the first six months of 2015. Now they represent more than 35 percent – the result of historically low interest rates.
• Investors are targeting lower-priced regional housing markets where they can get more favourable returns than are available in the main urban centres. This can be seen in the high number of new mortgage registrations to investors for Hawke’s Bay, Manawatu-Whanganui and Gisborne.
• Capital growth stalled in Auckland between 2017 and late 2019, prompting investors to take their money elsewhere. From late 2019, there has been a steady rise in the number of new mortgage registrations to investors.
• Auckland is dominated by refinancers and switchers, as homeowners there capitalise on capital growth to leverage equity.
The most pressing question for the market is, “how long can the surge last?” For example, since the first wave of returning expats, net migration has fallen sharply, and at some stage this impact will flow through to the market. And whilst economic conditions, as they relate to the housing market, seem positive now, there may well be future events that dent confidence and destabilise employment and financial security. Those who put off such concerns would be wise to remember that this time last year no one would have predicted a virus would spread with such damaging force and speed.
Off-the-cuff forecasting is something that’s best avoided, but those thinking about their next purchase, and how much debt that might involve, would do well to look at longer term implications of their decisions and not let “speculation” fever take hold.
Many of the levers to support demand and value levels remain in place but, there may still be tough ahead, with such high numbers of borrowers still on mortgage deferrals or interest only and such large uptakes on wage subsidies still in play.
Market overview - the major metros
AUCKLAND
Auckland’s housing market, starting to emerge from two-year-long slump this time last year, has shrugged off the effects of two lockdowns, with all regions exhibiting growth on the house price index since March 25. Of the 328 suburbs in the Greater Auckland region, just 36 (10 percent) were in worse place now than they were at the start of the Covid crisis. Pent up demand has continued to strengthen values. Manukau has enjoyed the biggest rise on the index (up 6 percent), followed closely by Rodney (up 5.2 percent). The North Shore has pulled itself out of the mud and the pace of growth now more in line with trends pre-lockdown.
Seven suburbs have recorded double-digit growth since March 25 - New Windsor, Pakuranga, Otahuhu, Opaheke, Glendene, Milford, Kingsland – while a further 105 suburbs showed value growth of above 5 percent.
Eight-six percent of suburbs in the $500K to $900K median value bracket showed growth, compared to 75 percent of suburbs in $1m-plus bracket. This reflects the fact that first home buyers are by far the most dominant buyer group, accounting for 33 percent of new mortgage registrations in the city in the last three months.
HAMILTON
Hamilton property values are up 4.7 percent on the house price index, with the current median value sitting at $635,000. Just four out the of the city’s 42 suburbs have declined on the index - Flagstaff, Maeroa, Forest Lake and Claudelands.
First home buyers are the most active buying group, with their share of mortgage registrations increasing to 30.1 percent in the last quarter. Investor activity remains stable – they accounted for 17.4 percent of new registrations during the same period. Like trends in other main centres, we continue to witness a more cautious mind-set among movers, accounting for only 6.4% of new mortgage registrations over the past quarter.
TAURANGA
Tauranga’s performance post-Covid has been solid but not spectacular, with property values on the index rising just 3.1 percent since March 25, with the median value sitting at $730,000.
In the 12 months to March 25, every suburb showed positive growth, with four suburbs - Matua, Bellevue, Tauranga South and Mount Maunganui - registering double-digit growth. Since lockdown, only six suburbs are down on the index - Tauranga South, Tauranga Central, Mt Maunganui, Ohauiti, Judea and Matua. However, it is important to note that sales volumes in these areas have been low, making value trends somewhat volatile.
First home buyers continue to dominate but investors are starting to move back into the fray, increasing their share of registrations to 18.8 percent in the last quarter.
WELLINGTON
Wellington continues to deliver strong results for the housing market, with the capital’s median value now $745,000, and its position on the index up 5.7% since March 25.
Much of this strength can be attributed to the fact that Wellington has been coming off a historically lower value base than other centres, which makes it attractive to first home buyers, who accounted for more than a third of new mortgage registrations last quarter, Certain locations are proving popular with investors, though, with that buyer slightly increasing their share of purchases on the previous quarter.
Strong Government employment in the area is expected to result in increased confidence among market participants seeking to locate to the area or acquire investment properties.
CHRISTCHURCH
Flat before Covid-19, Christchurch is now one of the housing market’s star performers, with the city up 6.6 percent on the index to reach a new median value $475,000, still the lowest median value for a major metro housing market in New Zealand.
At a suburb level, 94 of Christchurch’s suburbs are showing value growth, with the majority of these (68) showing growth of five percent or more since lockdown.
First home buyers are the main driving force in the market, accounting for a staggering 42 percent of new mortgage registrations over the last quarter. Investors and movers continue to adopt a more cautious approach, representing only 13.9 percent and 9.7 percent respectively.
QUEENSTOWN
Last year, we said “should’ve bought in Queenstown”. Does that still hold true, post-Covid? The ban on international visitors has hurt the city’s tourism economy, and as result the housing market has suffered. The city is at the bottom of the house price index rankings, with values down 4.4 percent since March 25.
But signs of a recovery are beginning to emerge, with anecdotal reports of increasing interest among numerous buyer groups.
In the last quarter, first home buyers and investors appear to have adopted a more confident position, increasing their share of new registrations to 28.4 percent and 27.3 percent respectively.
DUNEDIN
How the mighty have fallen. If there was a headline from last year’s market, it was: “Buy in Dunedin.” In the 12 months before Covid-19, Dunedin enjoyed strongest growth of New Zealand’s main urban centres – with values up 23.7 percent. That momentum has evaporated post-lockdown, with the city’s housing market registering growth of just 0.6 percent on the index. Whilst sales trends appear to be reversing, sales volumes still remain significantly subdued in Dunedin, the result of many market participants continuing to sit on the side-lines.
This approach appears to have had the biggest impact on investors, with their share of new mortgage registrations last quarter at just 16.3 percent. First home buyers remain the most active buyer group, capitalising on favourable interest rates, with their share representing 37.9 percent of new mortgage registrations.