Serious home buyers need to dig deep into data. But making sense of the numbers takes experience.
A wide variety of house price information is available through various sources, and it can help make sense of the market and how much buyers should expect to spend on a property. First home buyers should familiarise themselves with the data available from OneRoof/Valocity, the Real Estate Institute, CoreLogic, Massey University, surveys such as those from independent economist Tony Alexander and other sources.
The best place to start is with a suburb report for market insights. Take Waterview in central Auckland. Someone looking to buy in a suburb might start with the median sales price. That’s the middle price between the highest and lowest sales recorded in the suburb during a given time period.
But the median price is not the same as the average especially if there are outliers. A few super expensive properties or a lot of cheap apartments at the other end can skew things.
Start your property search
Waterview, for example, has a lot of student accommodation, priced for as little as the mid $500,000s thanks to the proximity of Unitec, and property values at the top end can reach as high as $3m. The median sales price can be good indicator of what buyers are paying, but the metric only reflects the sales prices of what has sold, and can be skewed by the types of stock that has come to market.
For example the median sales price in Auckland for November was $1.3m, but Auckland's average property value, which takes into account the value of every residential property in the city, whether or not it has sold in the last month, is according to OneRoof's House Value Index $1.552m.
“The important thing about that is don’t just look at the one figure: the suburb’s median value,” says James Wilson, director of valuations at OneRoof’s data partner Valocity. “Look under the hood and understand what are the value levels for the property you're actually looking to buy.”
Cheaper than the median
Wilson says first home buyers in particular can get disheartened by median sales prices and average property values. “If you're looking for an entry level property, you might actually find that it's a very different price point that you're talking about,” he says.
Take time to consider the house type. The median price for standalone homes in a suburb will be different from terraced homes. Buyers need to compare like for like. For example, while the median sales price in Waterview for all property types was $1.24m, it was $995,000 for flats which sounds a bit more affordable, and $672,000 for apartments.
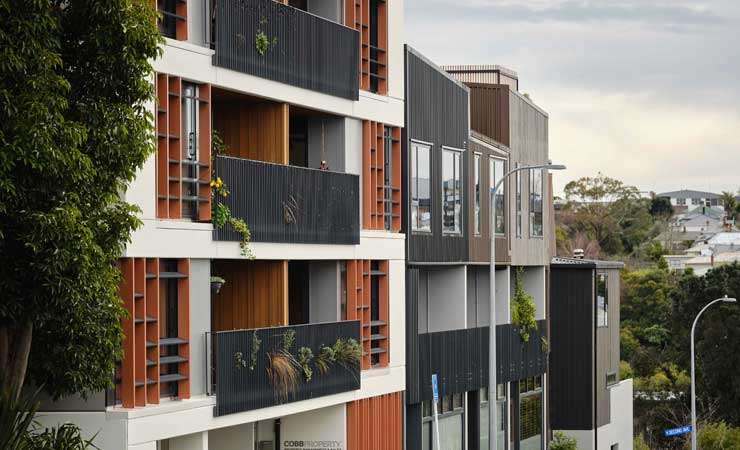
An apartment block in central Auckland. Apartments are typically lower in price than standalone homes. Photo / Fiona Goodall
Those apartment figures, however, could lead first home buyers astray in Waterview. Barfoot & Thompson agent Troy Evans, who was selling a five bedroom apartment in December for $530,000, said a number of purpose built apartments in Waterview could only be let to students, not house an owner occupier. Hence the price point.
How many properties on the market?
Wilson says the second piece of data to look into is volumes. “That is important. It’s how many properties are on the market in your area,” says Wilson. “Sales volumes and sales listings are important. They tell you whether there are a lot of properties on the market compared to usual, or comparatively few. It’s easier to buy if more properties are listed.”
Should there be a lot of properties on the market at any one time, it begs the question why, says Wilson. “Are there a whole lot of new builds that just come to market? Or is there a reason why every home in a street is selling?”
Also consider the percentage of properties being sold under the hammer at auction. If sales fail to hit reserve and the percentage of properties sold at auction drops, then the suburb could be is moving towards a buyers’ market from a sellers’ market.
Is housing affordable here?
The next data set to look at is housing affordability. Both CoreLogic and Massey University offer regular home affordability reports that delve into suburbs, towns and cities. They compare wage and salary data with house prices and tell buyers where they get the most for their money.
Buyers who can follow the jobs to other parts of the country might find it easier to buy, or make their money go further with a nicer house. But even though regional centres might be cheaper, if wages are lower it might be swings and roundabouts.

Valocity director of valuations James Wilson urges buyers to “look under the hood”. Photo / Supplied
Pre-Covid and hopefully post-Covid net migration figures will help explain where there will be pressure on house prices. Immigrants competing for the same houses as locals can push prices up, although it’s very difficult for non-residents to buy property in New Zealand. https://www.linz.govt.nz/overseas-investment/discover/our-investment-pathways/buying-or-building-one-home-live
Net migration figures are available from StatsNZ Tatauranga Aotearoa. Another useful source of data is the Reserve Bank of New Zealand Te Pūtea Matua (RBNZ), which tracks house prices and also mortgage rates. The RBNZ controls mortgage rates through the Official Cash Rate, which can have a flow on effect on house prices.
Capital growth
Investors and homeowners alike love to watch the price of their home rise. It makes them feel wealthy. Since Covid-19 hit house prices have been rising at frighteningly fast rates. Most economists expect that rate to level off in 2022 for a period of time.
Capital growth in one area, or property type, can differ from another. Capital growth in Waterview, for example,” was sitting at 29.9% for all properties in mid-December, 28.33% for residential dwellings, 18.84% for flats, and 42.28% for apartments.
Nearby Mt Albert is a much bigger suburb. It has a median sales price of $1.43m, rental yield of 3.07% and capital growth at 23.25%.
What investors need to know
Investors need to consider more than prices, says Wilson. They want to know how much rent they can expect to earn and what their return will be after costs.
To find out how much rent they might earn on a property, investors can look at Tenancy Services’, market rent search. https://www.tenancy.govt.nz/rent-bond-and-bills/market-rent/ It records bonds taken from properties, which are a reflection of the weekly market rental in an area.
It’s important to know that the lower, median and upper weekly rental prices don’t correlate directly with lower, median and upper priced homes. Rental homes in a suburb tend to be at lower end of the purchase price curve.
What’s more, investors won’t typically renovate to a high standard. They are more likely to look for a solid home and add whatever is necessary to make it appeal to renters, and bring it up to the government’s Healthy Homes standard.
Return on investment
Investors consider rental yields when purchasing a property. That’s usually gross yield, which is the percentage or rental income against purchase price. It’s a simple calculation that doesn’t take into account expenses.
Residential yields for Waterview as a whole were 3.33% in December, but 4.29% for flats, and a whopping 6.27% for apartments. Once costs are taken into account there may be very little if any profit week in week out, but this can be made up by capital growth over time.